After building features, eliminating bugs and cleaning up your code, you should spend some time looking at the performance of your application. The speed and smoothness with which your application draws pixels and performs operations has an significant impact on your users' experience.
Android applications operate within a shared resource environment, and the performance of your application can be impacted by how efficiently it interacts with those resources in the larger system. Applications also operate in a multithreaded environment, competing with other threaded processes for resources, which can cause performance problems that are hard to diagnose.
The systrace tool allows you to collect and review code execution data for your
application and the Android system. You can use this data to diagnose execution problems and
improve the performance of your application.
Overview
systrace helps you analyze how the execution of your application fits into the larger
Android environment, letting you see system and applications process execution on a common
timeline. The tool allows you to generate highly detailed, interactive reports from devices
running Android 4.1 and higher, such as the report in figure 1.
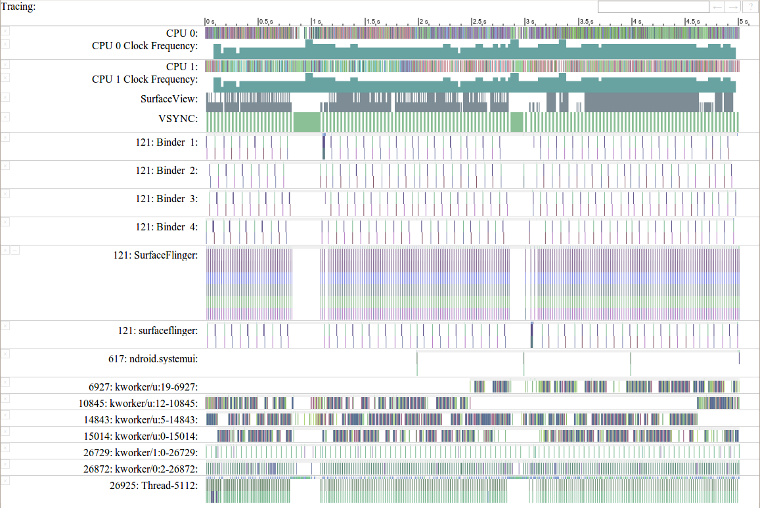
Figure 1. An example systrace report on 5 seconds of process execution
for a running application and related Android system processes.
Generating Traces
In order to create a trace of your application, you must perform a few setup steps. First, you
must have a device running Android 4.1 or higher. Setup the device for
debugging, connect it to your development
system and install your application. Some types of trace information, specifically disk activity
and kernel work queues, require root access to the device, but most systrace log data
only requires that the device be enabled for developer debugging.
Limiting trace data
The systrace tool can generate a potentially huge amount of data from applications
and system sources. To limit the amount of data the tool collects and make the data more relevant
to your analysis, use the following options:
- Limit the amount of time covered by the trace with the
-t, --timeoption. The default length of a trace is 5 seconds. - Limit the size of the data collected by the trace with the
-b, --buf-sizeoption. - Specify what types of processes are traced using the
--set-tagsoption and the--disk,--cpu-freq,--cpu-idle,--cpu-loadoptions.
Configuring trace data categories
To use systrace effectively, you must specify the types of processes you want to trace.
The tool can gather the following types of process information:
- General system processes such as graphics, audio and input processes (selected using trace Tags).
- Low level system information such as CPU, kernel and disk activity (selected using Options).
To set trace tags for systrace using the command-line:
- Use the
--set-tagsoption:$> python systrace.py --set-tags=gfx,view,wm
- Stop and restart the
adbshell to enable tracing of these processes.$> adb shell stop $> adb shell start
To set trace tags for systrace using the device user interface:
- On the device connected for tracing, navigate to: Settings > Developer options > Monitoring > Enable traces.
- Select the categories of processes to be traced and click OK.
Note: The adb shell does not have to be stopped and restarted when
selecting trace tags using this method.
Running a trace
After you have configured the category tags for your trace, you can start collecting information for analysis.
To run a trace using the current trace tag settings:
- Make sure the device is connected through a USB cable and is enabled for debugging.
- Run the trace with the low-level system trace options and limits you want, for example:
$> python systrace.py --cpu-freq --cpu-load --time=10 -o mytracefile.html
- On the device, execute any user actions you want be included in the trace.
Analyzing Traces
After you have generated a trace using systrace, it lists the location of the output
file and you can open the report using a web browser.
How you use the trace data depends on the performance issues you are investigating. However,
this section provides some general instructions on how to analyze a trace.
The reports generated by systrace are interactive, allowing you to zoom into and out of
the process execution details. Use the W key to zoom in, the S
key to zoom out, the A key to pan left and the D key to pan
right. Select a task in timeline using your mouse to get more information about the task.
For more information about the using the keyboard navigation shortcuts and navigation, see the
Systrace reference
documentation.
Long running processes
A well-behaved application executes many small operations quickly and with a regular rhythm, with individual operations completing within few milliseconds, depending on the device and the processes being performed, as shown in figure 2:
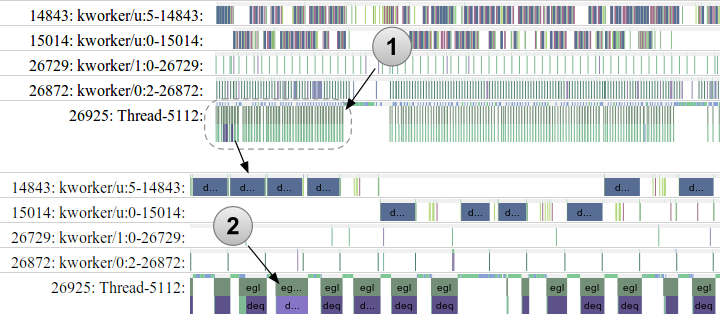
Figure 2. Excerpt from a trace of a smoothly running application with a regular execution rhythm.
The trace excerpt in figure 2 shows a well-behaved application with a regular process rhythm (1). The lower section of figure 2 shows a magnified section of the trace indicated by the dotted outline, which reveals some irregularity in the process execution. In particular, one of the wider task bars, indicated by (2), is taking slightly longer (14 milliseconds) than other, similar tasks on this thread, which are averaging between 9 and 12 milliseconds to complete. This particular task execution length is likely not noticeable to a user, unless it impacts another process with specific timing, such as a screen update.
Long running processes show up as thicker than usual execution bars in a trace. These thicker bars can indicate a problem in your application performance. When they show up in your trace, zoom in on the process using the keyboard navigation shortcuts to identify the task causing the problem, and click on the task to get more information. You should also look at other processes running at the same time, looking for a thread in one process that is being blocked by another process.
Interruptions in display execution
The systrace tool is particularly useful in analyzing application display slowness,
or pauses in animations, because it shows you the execution of your application across multiple
system processes. With display execution, drawing screen frames with a regular rhythm is essential
for good performance. Having a regular rhythm for display ensures that animations and motion are
smooth on screen. If an application drops out of this rhythm, the display can become jerky or slow
from the users perspective.
If you are analyzing an application for this type of problem, examine the
SurfaceFlinger process in the systrace report where your application is
also executing to look for places where it drops out of its regular rhythm.
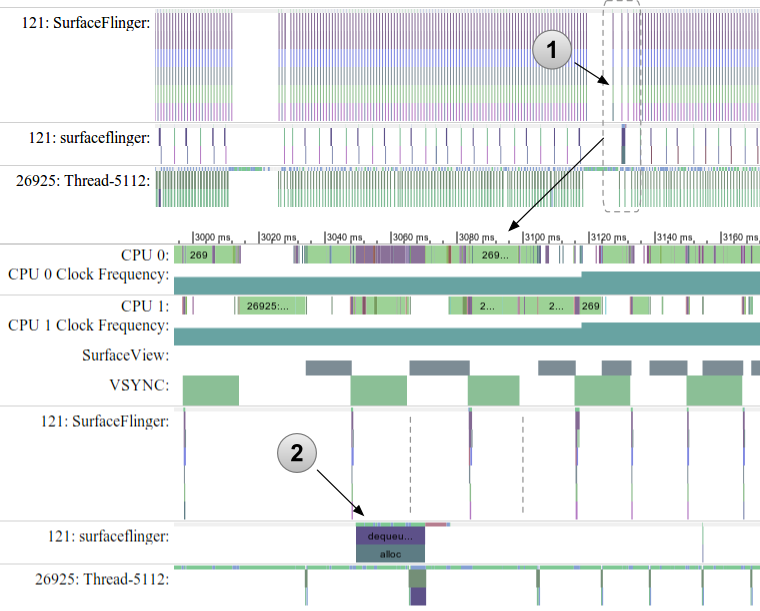
Figure 3. Excerpt from a trace of an application showing interruptions in display processing.
The trace excerpt in figure 3 shows an section of a trace that indicates an interruption in the device display. The section of the SurfaceFlinger process in top excerpt, indicated by (1), shows that display frames are being missed. These dropped frames are potentially causing the display to stutter or halt. Zooming into this problem area in the lower trace, shows that a memory operation (image buffer dequeuing and allocation) in the surfaceflinger secondary thread is taking a long time (2). This delay causes the application to miss the display update window, indicated by the dotted line. As the developer of this application, you should investigate other threads in your application that may also be trying to allocate memory at the same time or otherwise blocking memory allocation with another request or task.
Regular, rhythmic execution of the SurfaceFlinger process is essential to smooth display of screen content, particularly for animations and motion. Interruptions in the regular execution pattern of this thread is not always an indication of a display problem with your application. Further testing is required to determine if this is actually a performance problem from a user perspective. Being able to identify display execution patterns like the example above can help you detect display problems and build a smooth-running, high-performance application.
Note: When using systrace to analyze display problems, make sure
you activate the tracing tags for Graphics and Views.
For more information on the command line options and keyboard controls for systrace,
see the Systrace reference page.